Surface Roughness Parameters: Meaning & Measurement Methods
That is why surface roughness parameters are a standard part of technical drawings, process plans, and quality documentation across industries – from automotive and medical devices to precision mechanics and semiconductors.
Yet in practice, surface specifications often get reduced to a single number (usually Ra). That can work for some cases, but it can also hide important information about peaks, valleys, and functional behavior.
A more robust approach is to understand the most common surface roughness parameters, how they are measured, which standards apply, and how to select parameters that actually correlate with performance.
This article provides a practical overview of surface roughness parameters, explains key metrics such as Ra and Rz, outlines tactile and optical measurement approaches (with a clear focus on the advantages of optical metrology), and shows how standards like ISO 21920 and ISO 1302 support consistent communication and repeatable verification.
What are surface roughness parameters?
At a microscopic scale, no manufactured surface is perfectly smooth. Even after polishing, the surface contains micro-peaks and micro-valleys created by the manufacturing process. Surface roughness parameters are numerical descriptors that quantify these vertical deviations – either along a line (2D profile) or across an area (3D areal measurement).
In production, surface roughness parameters serve three practical purposes:
- They translate function into specification. Instead of “make it smooth,” engineers can define measurable targets tied to performance.
- They enable repeatable inspection. Requirements become verifiable across machines, operators, and sites.
- They improve process control. Tracking surface roughness parameters helps detect tool wear, vibration, material changes, or instability earlier.
Why surface roughness parameters matter for function and service life
Many issues that look like “material problems” are actually surface-driven. Changes in surface roughness parameters can shift contact mechanics, lubrication behavior, stress concentration, and sealing performance – sometimes enough to reduce lifetime or increase failure rates.
Typical functional links include:
- Friction and wear: Surface peaks influence abrasion; controlled textures can also support lubrication retention.
- Sealing: Too rough can leak; too smooth can increase stick-slip or reduce lubrication effects depending on the seal concept.
- Fatigue strength: Peaks can act like micro-notches that raise local stress.
- Coating/bonding: Texture influences adhesion, mechanical interlocking, and surface preparation quality.
- Medical/clean applications: Texture can impact cleanability or interaction with biological materials depending on the use case.
In short: surface roughness parameters define the micro-geometry that helps components perform reliably and consistently over time.
Key surface roughness parameters: Ra and Rz (and what they tell you)
In technical drawings and shop-floor discussions, Ra and Rz remain the best-known surface roughness parameters. They are useful – but they describe different aspects of the same surface.
Ra: average roughness
Ra (arithmetical mean roughness) is the average absolute deviation of a profile from the mean line over the evaluation length. It is popular because it is stable and easy to trend.
What Ra is good at:
- Process monitoring and comparative tracking
- Simple communication across teams
What Ra can miss:
- Extreme peaks/valleys (two surfaces can share the same Ra but behave differently in use)
Rz: height-related roughness (profile-based)
Rz emphasizes peak-to-valley information more strongly than Ra (exact definitions depend on the standard and evaluation rules). In applications where extremes drive function – such as sealing, contact, or wear – Rz can provide an additional safety layer.
Practical takeaway: relying on one value alone can oversimplify. Selecting surface roughness parameters should follow the function of the surface, not just tradition.
Optical vs. tactile measurement: why optical is often the better choice
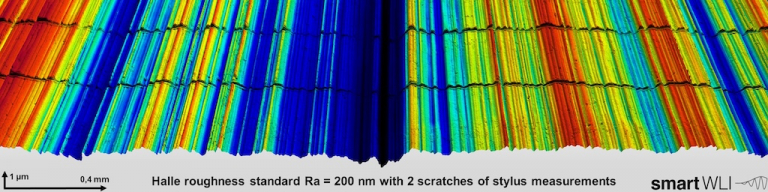
To specify and verify surface roughness parameters reliably, the measurement method matters. In practice, two approaches are common: tactile stylus measurement and optical, non-contact metrology. While tactile profilometry is widespread, optical measurement is increasingly the preferred option – especially when precision, speed, and surface integrity matter.
Tactile measurement: established, but inherently constrained
Tactile instruments trace the surface with a stylus and record a line profile. This is familiar to many QC teams and can work well for robust, easily accessible surfaces.
However, tactile measurement faces limitations that matter more and more in modern manufacturing:
- Contact influence: The stylus physically interacts with the surface, which can be problematic for soft, coated, delicate, or micro-structured parts.
- Line-based sampling: One profile line may not represent the full surface, especially when texture varies across an area.
- Lower efficiency for complex needs: Multiple traces and careful setup increase inspection time.
- Wear/setup sensitivity: Stylus condition, tip radius, probing force, and alignment can affect reported surface roughness parameters.
Optical measurement: non-contact, faster, and more representative
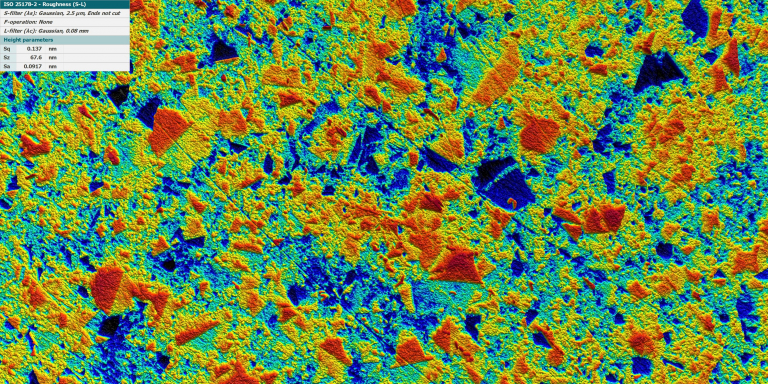
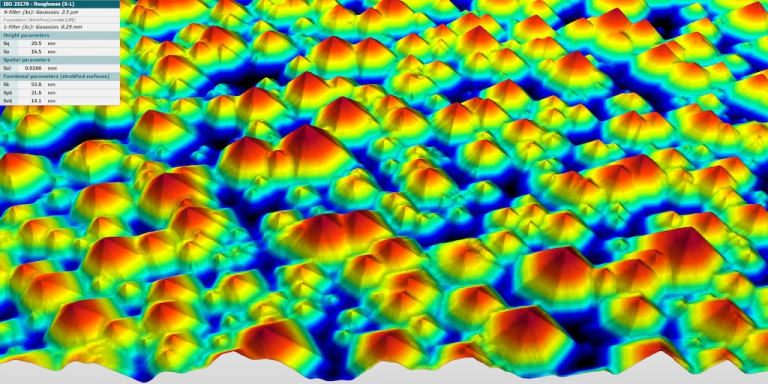
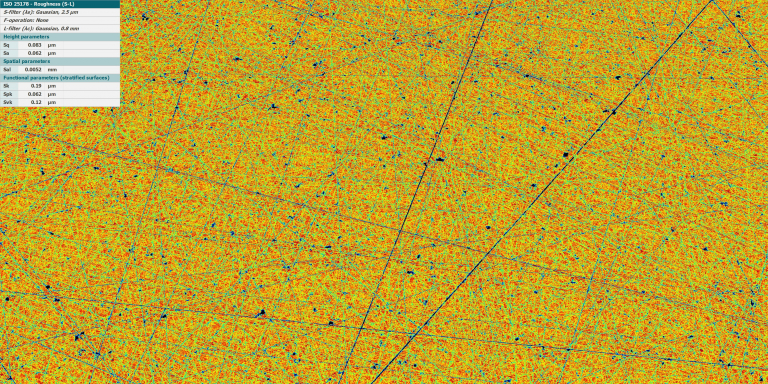
Optical methods measure surface topography without touching the part. More importantly, they can capture dense 3D information, which is often more representative for functional surfaces than a single line trace.
Key advantages of optical metrology:
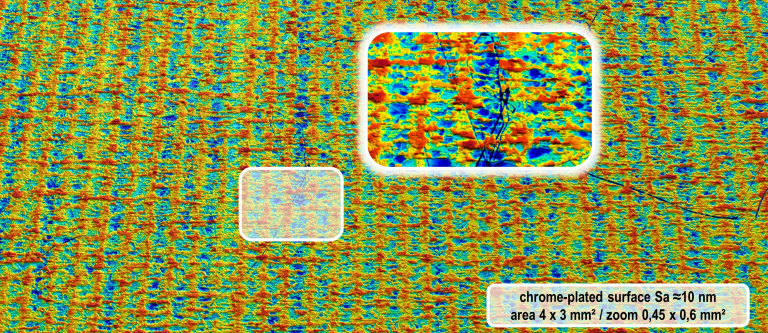
- Non-contact by design: No risk of mechanical influence – ideal for polished, delicate, soft, or coated surfaces.
- Areal/3D capability: Larger areas can be evaluated, producing a more realistic picture of functional texture and reducing sampling risk.
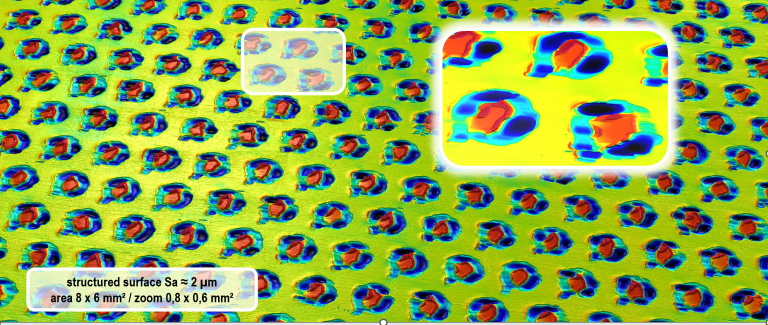
- High precision for micro-structures: Advanced optics can resolve extremely fine vertical features that are difficult to capture consistently with contact methods.
- High speed and productivity: Faster acquisition and evaluation enable more frequent checks and tighter feedback loops.
If your goal is to understand, control, and optimize surface roughness parameters as a performance driver – not just to record a single number – optical measurement is often the stronger strategic choice.
Standards and drawing communication: ISO 21920 and ISO 1302
Consistency depends on more than a measurement device. Surface roughness parameters must be communicated and evaluated within a clear standard framework; otherwise, different teams can measure “correctly” and still get different results.
Two standards are especially relevant:
- ISO 1302 defines how to indicate surface texture requirements in technical documentation. It supports unambiguous communication of the parameter, the value, and related notes.
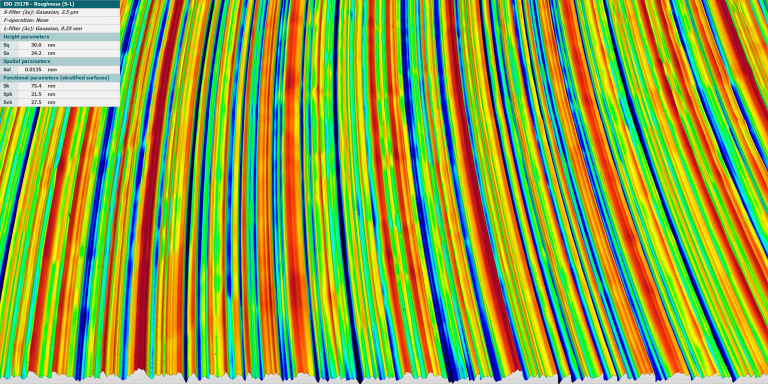
- ISO 21920 (2021) modernizes profile surface texture rules and evaluation concepts. Clear decision rules (including “max rule” concepts in practical usage) help reduce ambiguity in acceptance criteria.
Practical takeaway: stable results require not only the parameter value, but also consistent evaluation settings aligned with standards – otherwise, the same surface roughness parameters may not be comparable across sites or suppliers.
Selecting the right surface roughness parameters for your application
A reliable surface requirement starts with the functional goal and ends with measurable surface roughness parameters that correlate with it. A simple selection logic looks like this:
- What does the surface need to do? Seal, slide, bond, resist wear, carry a coating?
- Which surface features are critical – average texture, extreme peaks, or valley structure?
- Which measurement method can verify the requirement reliably in your workflow?
- What’s the risk near the tolerance limit (false accept / false reject)?
In many industrial scenarios, combining parameters is more robust than relying on only one. For example, Ra can stabilize process monitoring while Rz adds sensitivity to peak/valley behavior. The best mix depends on application, material, and the measurement approach used to generate the numbers.
Manufacturing influence: roughness “classes” and typical process outcomes
Manufacturing methods create characteristic textures. Some teams use roughness class ranges (often referenced as N1 to N12) as a quick orientation, but real capability always depends on tooling, parameters, and material.
Broad tendencies:
- Grinding often produces finer textures
- Cutting/turning/milling can range from fine to medium depending on settings
- Rolling/forming often yields coarser textures depending on the process
The key point is that surface roughness parameters are process-dependent. When tool wear increases, vibration changes, or feeds and speeds drift, roughness can shift even if dimensional tolerances remain in control.
Why precise Roughness measurement pays off
Organizations invest in measuring surface roughness parameters precisely because it reduces cost and risk:
- Lower scrap and rework: Earlier detection of drift prevents larger batches of nonconforming parts.
- Better machine setup: Texture feedback accelerates parameter optimization and reduces trial-and-error.
- Improved reliability: Controlled surfaces improve performance and service life.
- Stronger supplier alignment: Shared surface roughness parameters reduce ambiguity and disputes.
- Higher confidence in compliance: Standards-based verification strengthens audits and documentation.
Measuring surface roughness parameters with GBS metrology

GBS metrology helps companies analyze micro- and nano-scale surface structures with high confidence – so surface roughness parameters become a reliable basis for decisions in quality control, process optimization, and R&D.
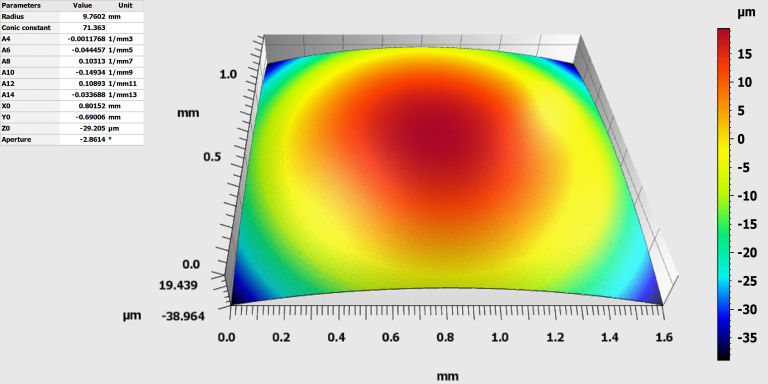
With our high-precision 3D surface metrology based on white light interferometry, surfaces can be measured in outstanding detail down to the nanometer range. This supports stronger process reliability, clearer specifications, and more consistent results across measurement cycles.
Our smartWLI products combine precision with speed through GPU-based image processing, enabling significantly shorter measurement times and faster evaluation. This makes it easier to integrate surface inspection into real workflows – whether for incoming inspection, advanced lab analysis, or production-oriented monitoring.
Because every application is different, we deliver tailored systems for research and industry alike. The versatility of our solutions supports a wide range of use cases – particularly in semiconductor and medical technology environments where non-contact measurement and high-resolution data are essential.
FAQ
Surface roughness parameters are standardized numerical descriptors that quantify micro-scale height deviations of a surface. They help specify and verify functional surface requirements in manufacturing and quality control.
Ra represents average deviation from the mean line, while Rz is more sensitive to peak-to-valley behavior (depending on the standard definition). Both are widely used surface roughness parameters, but they describe different surface characteristics.
They are commonly measured using tactile profilometry (stylus-based) or optical methods (non-contact). Evaluation settings and standards alignment strongly influence the reported surface roughness parameters.
Discover more news about GBS
In industrial metrology, confidence in data is everything.
Read more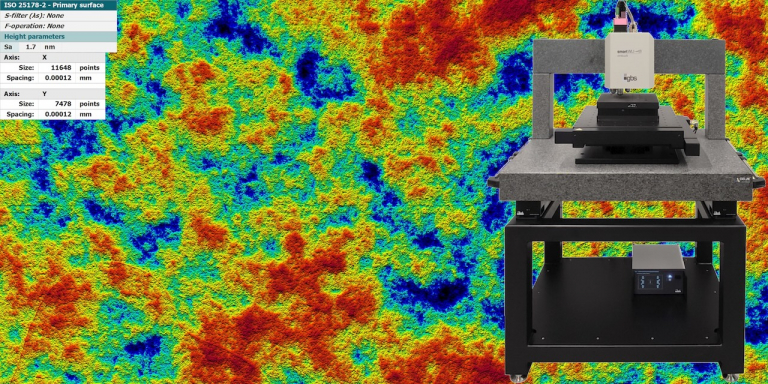
As a top-class white-light interferometer, the smartWLI nimbus8 naturally offers extremely high height resolution. With regard to lateral…
Read more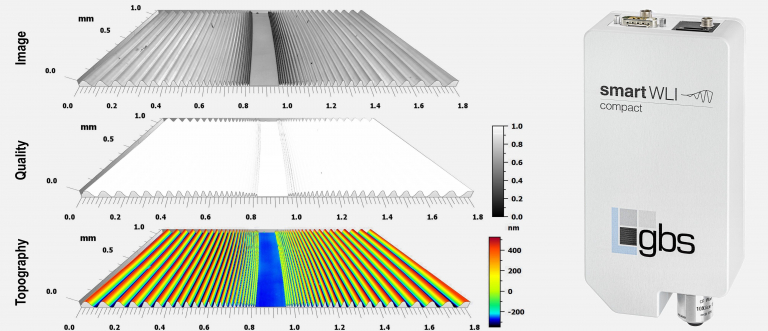
Powerful hardware ensures fast measurements — that is obvious. In the smartWLI series, however, the available computing power…
Read more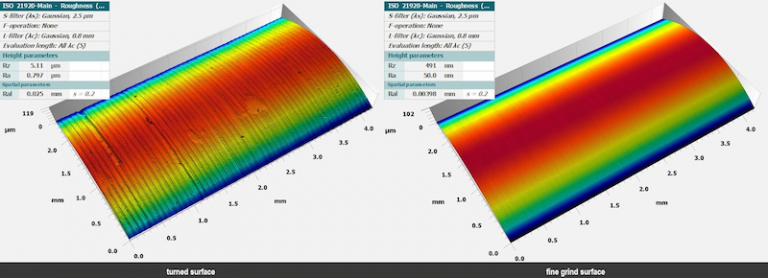
Optical profilometry has advanced rapidly in recent years. While it was once primarily evaluated by how well it…
Read more