Measurement Uncertainty: Meaning, Drivers, and Reduction
In industrial metrology, confidence in data is everything. Whether you’re validating a surface finish, qualifying a production step, or releasing safety‑critical parts, you’re ultimately asking one question: “How reliable is this measurement result?” That reliability is expressed through measurement uncertainty.
Measurement uncertainty is not a flaw you “fix once” and forget. It’s an inherent property of every measurement system and every measurement process – shaped by the instrument, the environment, the operator, the part, and the evaluation method.
The goal is not to eliminate measurement uncertainty entirely (that’s impossible), but to understand it, quantify it, and control it so measurement results become a stable foundation for process decisions.
- Measurement uncertainty is unavoidable – but controllable:
Every measurement includes uncertainty. By quantifying and managing measurement uncertainty, teams improve decision-making, process stability, and product quality. - Environment, calibration, and sensor performance drive results:
Factors like temperature/vibration, sensor quality, and regular calibration/traceability have a major impact on measurement uncertainty and long-term comparability of measurement data. - Modern optical 3D metrology can reduce uncertainty in surface analysis:
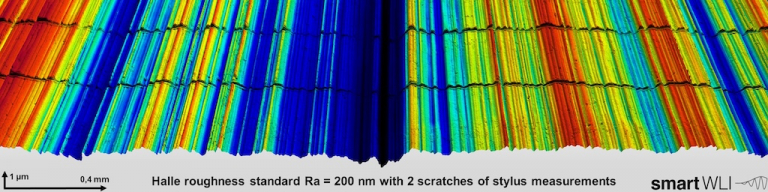
White light interferometry (coherence scanning interferometry) enables non-contact, high-resolution measurements of micro- and nanostructures, while GPU-based processing supports fast, robust evaluation for production and inline use.
What is measurement uncertainty?
Measurement uncertainty describes the range around a measured value within which the true value is expected to lie – under defined conditions and with a defined level of confidence. In other words: it tells you how much “wiggle room” is realistically attached to a measurement result.
This matters because two measurements can show the same number while carrying very different levels of certainty. If the measurement uncertainty is large, you may be making decisions on weak evidence – especially when tolerances are tight.
A helpful way to think about it:
- The measured value is the number we report.
- The measurement uncertainty describes how much that number could reasonably shift due to influences we can’t fully remove.
Precision vs. accuracy: why the difference matters
Teams often use “accuracy” and “precision” interchangeably, but for measurement quality they describe different behavior:
- Precision means repeatability: repeated measurements under the same conditions cluster tightly.
- Accuracy means closeness to a reference or true value.
A system can be very precise and still be inaccurate – for example, when a systematic error (bias) shifts all results in the same direction. This distinction is crucial because improving precision alone doesn’t necessarily reduce measurement uncertainty if bias, drift, or environmental effects remain.
A quick example: when uncertainty changes a pass/fail decision
Consider a shaft diameter with a specification of 10.000 mm ± 0.005 mm. Your measurement result is 10.004 mm. On paper, that looks like a pass. But if the reported measurement uncertainty is ± 0.006 mm (k=2), the true value could plausibly be outside the upper limit.
In that case, the same measurement result can no longer support a confident release decision without a defined decision rule (e.g., guard bands) or a reduction in uncertainty.
This is why teams that manage measurement uncertainty well often see benefits beyond “better numbers”: fewer borderline disputes, clearer release criteria, and more robust process capability assessments – especially when tolerances are tight and cost of failure is high.
What increases measurement uncertainty in practice?
Measurement uncertainty is rarely caused by one single factor. Most of the time it’s a combination of influences that add up. Common drivers include:
- Sensor and system quality
Higher‑quality sensors and optics generally improve signal stability and reproducibility – especially in high‑resolution surface metrology. - Environmental conditions
Temperature variation, vibration, pressure changes, airflow, and contamination can distort results or add variability – particularly when measuring fine micro‑ and nanostructures. - Calibration and traceability
Regular calibration is essential to keep results comparable over time and aligned with standards. Without it, drift and offsets quietly increase measurement uncertainty. - Nonlinearity, hysteresis, drift
These classic error sources can change the relationship between the measured signal and the true value. Even if a system “looks stable” day to day, these effects can accumulate – especially without systematic monitoring.
Technology as a lever: why optical 3D metrology can help
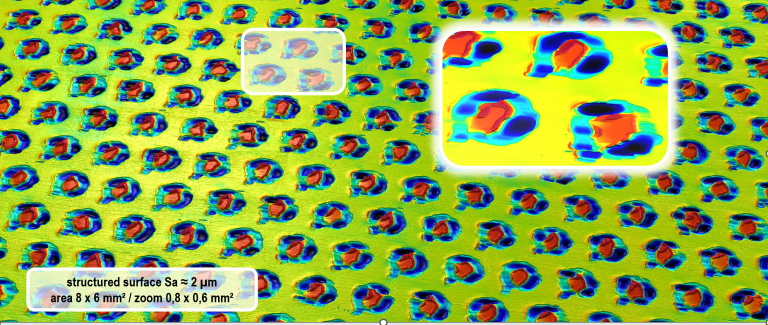
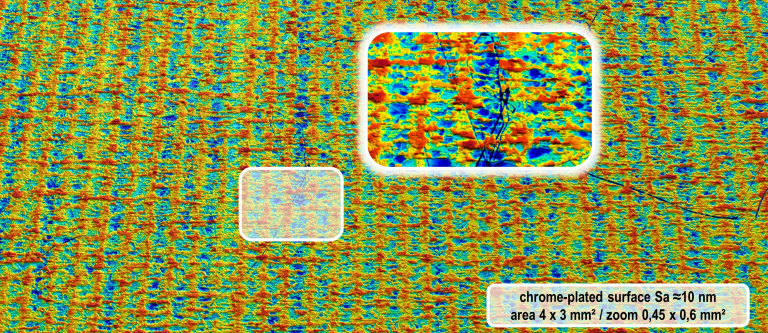
When parts are sensitive, structures are small, or throughput matters, modern optical approaches are often a strong path to control measurement uncertainty – especially in surface measurement.
A key example is white light interferometry (also known as coherence scanning interferometry). It enables detailed, non-contact surface topography measurement down to micro‑ and nanometer scales – making it a practical option for demanding applications such as semiconductor manufacturing, medical technology, and high‑end quality assurance.
In addition, modern data pipelines can further stabilize results:
- GPU‑accelerated processing (GPGPU) can evaluate large datasets quickly and consistently.
- Faster evaluation reduces “waiting time variability” and enables more frequent measurement, which improves process control.
- Robust algorithms and optimized evaluation workflows help turn raw measurement data into dependable decisions.
Where measurement uncertainty becomes business‑critical
Measurement uncertainty is not only a lab topic. It becomes a practical cost and risk driver whenever decisions depend on small differences – especially in sectors such as:
- Automotive manufacturing (process capability, friction behavior, sealing surfaces)
- Medical technology (patient safety, tight verification needs)
- Aerospace (high consequence of release errors, strict documentation requirements)
In these environments, good measurement practices reduce the chance of false decisions:
- rejecting good parts (scrap and cost),
- accepting bad parts (risk and liability),
- or continuously “overcorrecting” stable processes due to noisy measurement signals.
Calibration: the most underrated uncertainty reducer
If we had to pick one lever that helps almost every organization: it’s disciplined calibration and traceability.
Regular calibration helps to:
- reduce systematic and random effects,
- improve comparability across time and across sites,
- support quality systems (e.g., ISO 9001 environments),
- lower risk in approval and release processes.
Calibration doesn’t replace good measurement design – but without it, measurement uncertainty tends to creep upward silently.
From data to decisions: making measurement uncertainty manageable
The strongest results come when measurement uncertainty is addressed as a system – not as a single instrument spec. That includes:
- selecting the right measurement principle (contact vs. non-contact),
- controlling the environment,
- building a robust calibration plan,
- using consistent evaluation algorithms,
- validating the measurement system (e.g., repeatability, reproducibility, stability).
Done well, measurement uncertainty becomes predictable and controllable – which is exactly what teams need for stable, scalable production.
The goal isn’t “minimum uncertainty” – it’s the right uncertainty for the job
It’s tempting to chase the lowest possible measurement uncertainty – but the better engineering question is: What uncertainty level is needed for this decision, at this speed, in this environment?
A lab measurement strategy may be technically excellent but too slow for production. An inline approach may be fast but requires robust algorithms and stable process conditions to maintain uncertainty within an acceptable window.
When teams define “fit-for-purpose” targets – based on tolerance, risk, throughput, and documentation needs – they can choose the right combination of measurement principle, automation level, and evaluation workflow.
That’s also where modern optical 3D metrology and accelerated data processing can become a competitive advantage: not only measuring precisely, but measuring reliably and repeatedly under real manufacturing constraints – supporting lower measurement uncertainty where it matters most.
Turning measurement uncertainty into an advantage with GBS metrology

Measurement uncertainty can’t be removed – but it can be controlled when measurement principle, evaluation, and production reality fit together.
This is where GBS metrology supports customers: the smartWLI product line provides optical 3D sensors and 3D profilers based on white light interferometry (coherence scanning interferometry) to capture micro‑ and nanostructures in high detail.
Combined with GPU‑based image processing, this enables short measurement times and fast, robust evaluation – from lab setups to near‑production and inline integration.
Ongoing advances in hardware and software open up further opportunities in quality assurance and process monitoring: automation-ready workflows, powerful algorithms, and system designs built for reproducibility, comparability, and practical integration. That turns measurement data into reliable decision support – not only for spot checks, but for stable processes.
If you want to reduce measurement uncertainty and raise your surface analysis to the next level, contact GBS metrology for a non-binding consultation – or request a free test measurement using your own samples.
FAQ
Measurement uncertainty and measurement quality are often evaluated using metrics such as mean, standard deviation, and confidence intervals. In practice, repeat measurements, comparison measurements, regression analysis, and measurement system analysis (e.g., Gage R&R) are used to quantify variation, bias, and stability.
The true value is an idealized value of a measurand that typically cannot be known exactly. In real workflows it is approximated by reference values – such as calibrated standards or higher-accuracy reference measurements – used to evaluate deviations.
A systematic deviation is a reproducible effect that shifts results consistently in one direction – for example due to incorrect calibration or an offset. Unlike random variation, it does not shrink by repeating measurements. It can be reduced through adjustment, calibration, and root-cause analysis.
Discover more news about GBS
Surface finish is rarely a “nice-to-have.” In many applications it is a functional requirement that influences friction, sealing…
Read more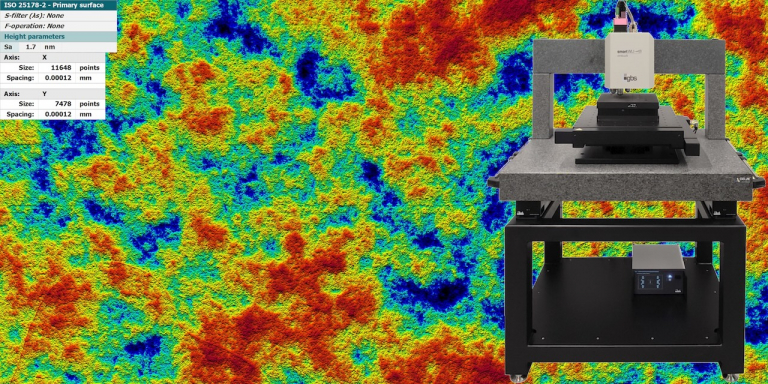
As a top-class white-light interferometer, the smartWLI nimbus8 naturally offers extremely high height resolution. With regard to lateral…
Read more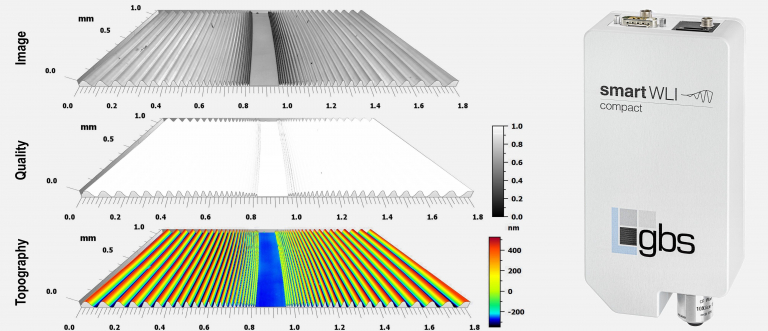
Powerful hardware ensures fast measurements — that is obvious. In the smartWLI series, however, the available computing power…
Read more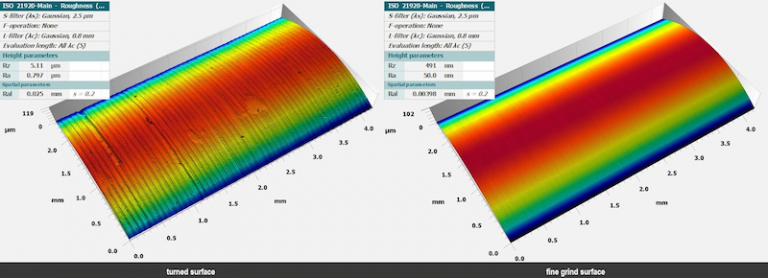
Optical profilometry has advanced rapidly in recent years. While it was once primarily evaluated by how well it…
Read more