Precision vs. Accuracy: How Modern 3D Profilers Make Surfaces Measurable
-
Clear distinction between precision and accuracy
-
Optical 3D profilers deliver up to 8 million measurement points per scan
-
8 MP camera with a 10× objective enables spatial sampling ≤ 0.5 µm
-
Advanced algorithms like HD-EPSI+ reduce noise to <0.1 nm
-
ISO 21920 requires sampling ≤ 0.5 µm for roughness measurement
-
Power Spectral Density (PSD) allows system comparability
-
Test measurements and applicable standards ensure reliable results
In metrology, users frequently encounter the terms precision and accuracy. While often used interchangeably, they describe different aspects of measurement quality. Demands on surface analysis are continuously increasing due to miniaturization and rising quality standards in manufacturing. In optical 3D metrology, the ability to capture both precise and accurate values determines the value of measurement data for research, development, and production.
Precision and Accuracy: The Basics
Precision describes how closely multiple measurement results agree when performed under identical conditions. Accuracy refers to how close a measurement result is to the true value. A system can be very precise yet still inaccurate if a systematic error is present. In surface metrology, precision is crucial for the repeatability of measurements, while accuracy ensures comparability with standards.
How Do Technical Parameters Affect Precision and Accuracy?
The technical specifications of a measurement system directly influence both precision and accuracy. Lateral resolutiondetermines how finely surface details are captured. Smaller sampling intervals allow more details to be represented over a larger area. A high-resolution camera, for example 8 megapixels, provides significantly more measurement points per scan than lower-resolution systems.
A defined sampling interval, such as 0.5 µm, is required to meet the ISO 21920 standard for roughness measurements. Signal quality, particularly image noise, affects precision. Modern algorithms reduce noise, enhancing measurement reliability, especially for roughness analysis.
Summary of Key Technical Factors:
-
Lateral resolution and sampling interval determine the level of detail.
-
Higher camera resolution provides more measurement points per scan.
-
Reduced noise increases precision in roughness measurements.
-
ISO 21920 requires a maximum sampling interval of 0.5 µm.
Advanced Optical 3D Metrology: Setting New Standards for Precision and Accuracy
Modern optical 3D profilers, such as the smartWLI series, combine high-resolution cameras with powerful graphics cards. 8-megapixel cameras allow up to 8 million measurement points per scan to be captured with a defined sampling interval. Data evaluation occurs in real time directly on the graphics card, eliminating the need for intermediate storage of image data.
Unlike systems that use binning methods and evaluate only a portion of the measurement points, these profilers retain the full detail of the surface. This enables large areas to be measured with high precision and accuracy.
Measurement Algorithms Compared: From VSI to HD-EPSI+
The precision and accuracy of a measurement are influenced not only by hardware but also by the algorithms used.
-
VSI (Vertical Scanning Interferometry) offers a large measurement range but does not achieve sub-nanometer resolution.
-
HD-VSI reduces noise by using smaller increments.
-
PSI (Phase Shift Interferometry) delivers high vertical resolution but is limited to a small height range.
-
EPSI combines the advantages of VSI and PSI.
-
HD-EPSI and HD-EPSI+ use fine increments and an unwrapping procedure to measure even steep and reflective surfaces with sub-nanometer accuracy.
The Impact of Camera Technology on Precision and Accuracy
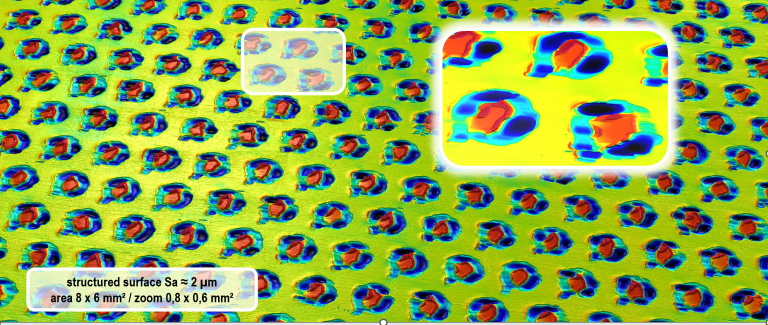
Camera resolution has a direct effect on measurement quality. While a 1.3 MP camera with a 20× objective allows a lateral sampling of 0.65 µm, an 8 MP camera under the same conditions achieves 0.25 µm.
The difference becomes especially noticeable when measuring microlens structures or steep flanks. Higher resolution provides more detail, better signal quality, and enables the use of advanced algorithms such as HD-EPSI+, resulting in increased precision and accuracy of the measurement data.
Advantages of High-Resolution Cameras:
-
More detail through smaller sampling intervals.
-
Improved signal quality on steep surfaces.
-
Enables advanced algorithms like HD-EPSI+.
-
Enhanced measurement results for microstructures.
Noise Reduction and Topography Reproducibility: How Modern Algorithms Enhance Precision
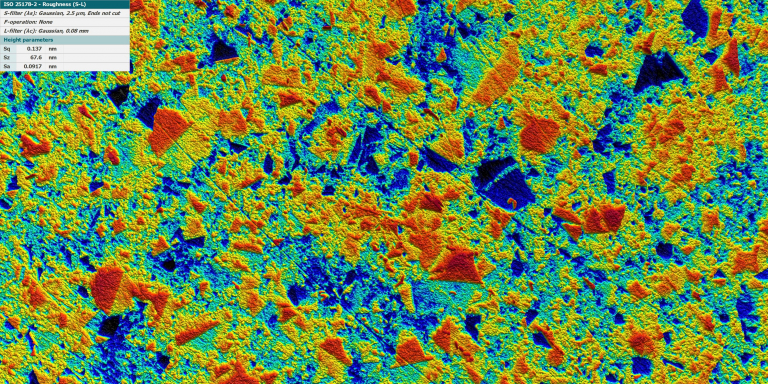
Low noise levels are crucial for precise measurements. Using a smartWLI firebolt with a 50× objective and HD-EPSI, under measurement conditions with an increment of 8.75 nm and 40 repetitions, the roughness difference Rq Δz is less than 10 pm, achieving a topography reproducibility of 7 pm.
By comparison, traditional VSI methods show values around 10 nm. Advanced algorithms thus enable significantly higher reproducibility, providing better control over measurement results, particularly when measuring sub-angstrom roughness.
ISO 21920 and the Importance of Defined Sampling Intervals
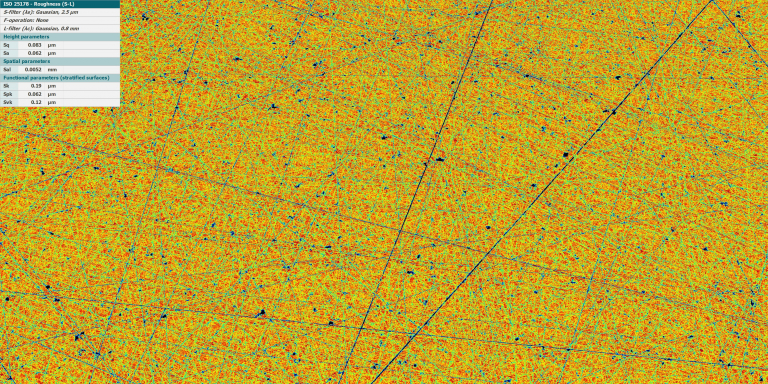
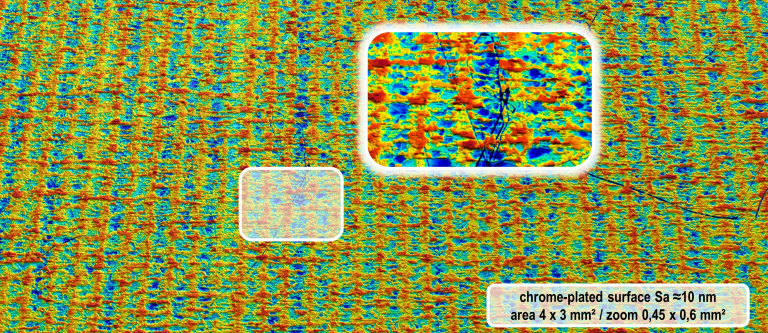
ISO 21920 specifies a sampling interval of ≤ 0.5 µm for roughness measurements. Systems such as the smartWLI firebolt8 and nimbus8 meet this requirement with an 8 MP camera and a 10× objective.
Adhering to the defined sampling interval ensures that even small roughness features are reliably captured. This is essential for documentation and traceability of measurement results and provides confidence during audits and certifications.
Power Spectral Density (PSD): New Approaches to Quality Assessment
Analyzing the Power Spectral Density (PSD) allows for an objective comparison of different measurement systems and technologies. It reveals which structures and details a system can actually capture, independent of manufacturer specifications.
PSD analysis enables a direct performance comparison of coherence scanning (white-light) interferometry, confocal microscopy, focus variation, and other techniques. Users benefit from a clear decision-making basis when selecting a measurement system.
Practical Tips: Choosing the Right System and Standards for Your Application
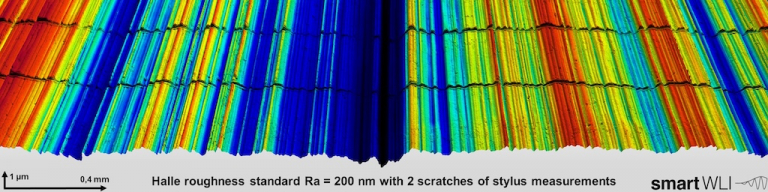
When selecting a measurement system, it is advisable to clearly define the requirements of your specific application. Using appropriate roughness standards and performing test measurements on real samples helps to verify the suitability of a system.
Standards should be chosen to represent the relevant structures of the surfaces to be measured. Consulting with experienced users or system providers can simplify the selection process and minimize the risk of measurement errors.
The Future of Precision and Accuracy Measurement with GBS Metrology

Precision and accuracy are not opposites—they complement each other in advanced measurement technology. Modern optical 3D profilers, such as the smartWLI series, enable exact and repeatable analysis of even the most complex surface structures. The combination of high-resolution hardware, powerful algorithms, and ISO-compliant proceduresprovides a reliable foundation for trustworthy measurement results in research, development, and industrial production.
Continuous advancement in hardware and software brings faster measurements, higher resolution, and enhanced analysis capabilities. Automated workflows and sophisticated algorithms ensure consistent results and open new possibilities in quality assurance and process monitoring. Integration into digital workflows and adherence to current standards secure the long-term viability of the measurement systems.
Looking to elevate your processes to the next level? Rely on GBS metrology. Contact us for a no-obligation consultation or request a free test measurement using your own samples!
FAQ
Precision describes how closely multiple measurement results lie to each other under the same conditions. Accuracy indicates how close a measurement result is to the true value. Both properties are essential for reliable measurement results.
Higher camera resolution allows more measurement points per scan and improves the level of detail. This makes it possible to capture fine structures and steep edges more accurately. Modern systems like smartWLI operate with up to 8 MP and a defined sampling density.
The sampling interval determines how finely a surface is scanned. ISO 21920 requires ≤ 0.5 µm to ensure that even small roughness features are reliably detected. This is the only way to guarantee measurement results that are reproducible and comparable.
Discover more news about GBS
Optical profilometry has advanced rapidly in recent years. While it was once primarily evaluated by how well it…
Read more