Setting New Standards in White Light Interferometry: Making Data Quality Visible
Powerful hardware ensures fast measurements — that is obvious. In the smartWLI series, however, the available computing power is not only used for speed, but specifically for evaluating the quality of measurement data. As a result, an additional quality layer is generated alongside topography and image data, assessing the reliability of each individual measurement point.
This approach forms the basis for Advanced Quality Control, or AQC. The goal is to reliably detect outliers and artifacts without suppressing relevant measurement information. This not only makes the measurement faster, but also makes the evaluation of the results more robust and trustworthy.
Why Data Quality Is Essential in CSI/WLI
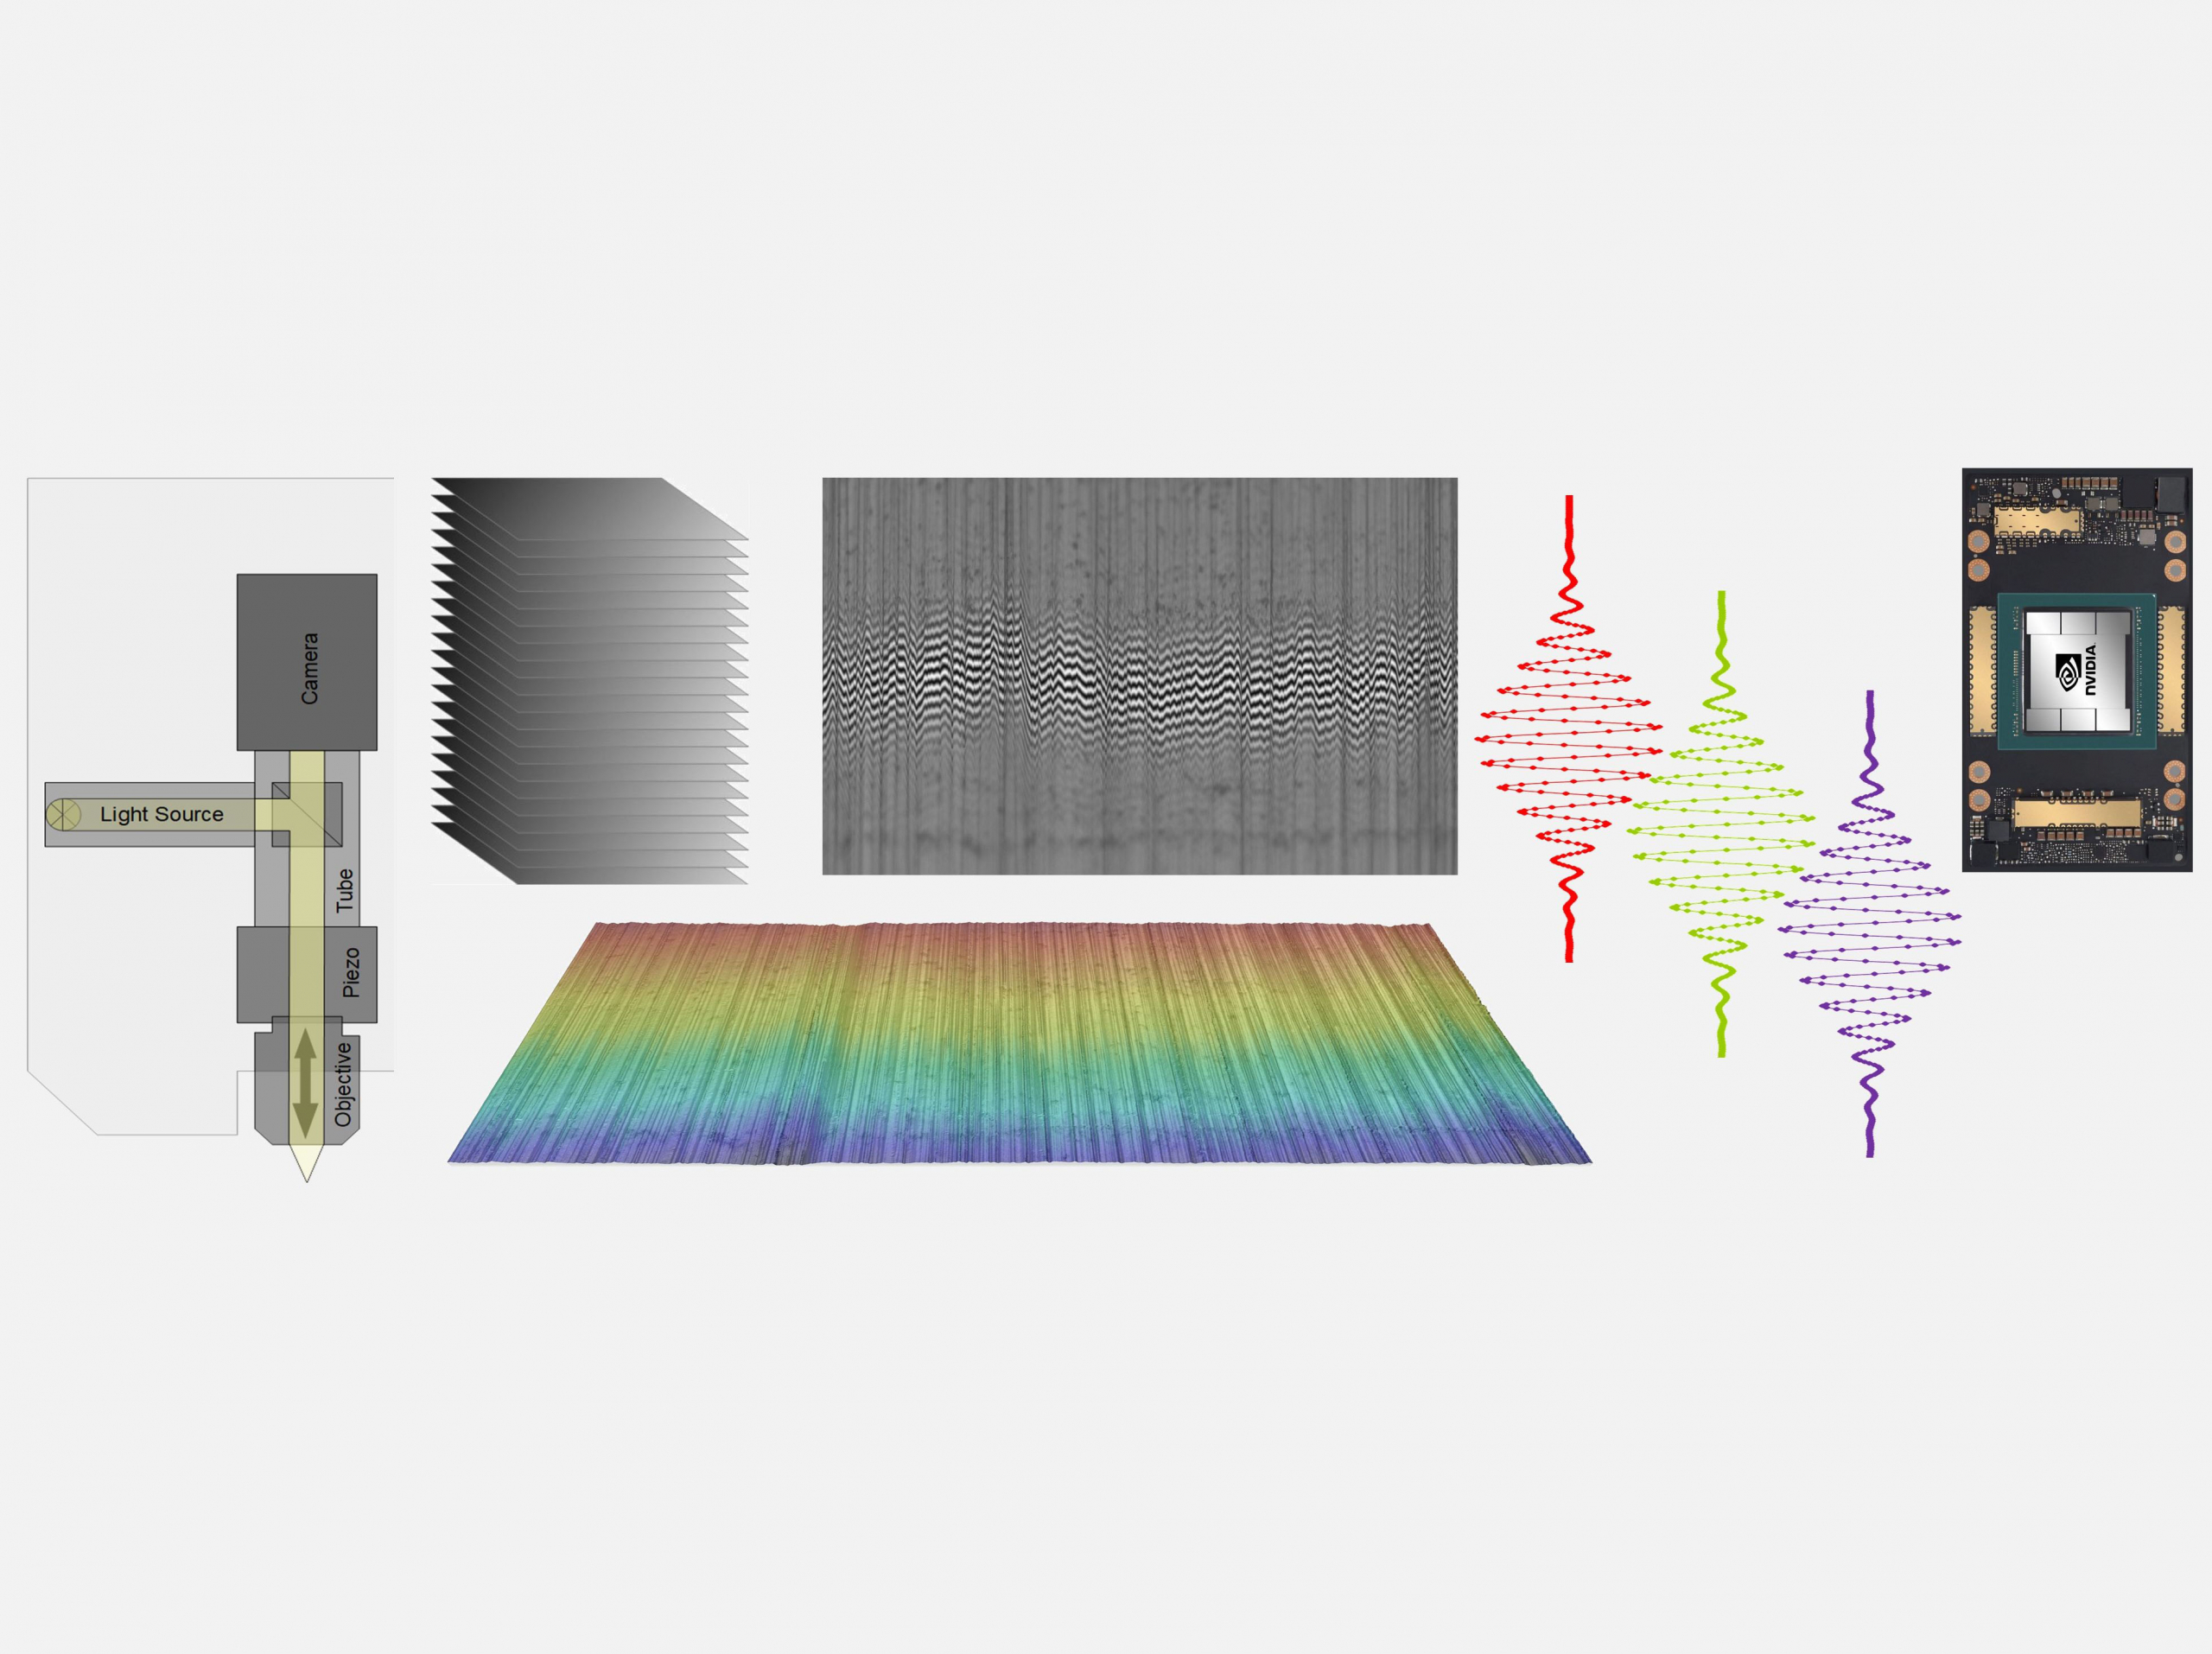
In white light interferometry, or CSI/WLI, the objective is moved vertically through the focus region of the surface. Within this region, interference signals are generated and recorded for each camera pixel as a so-called correlogram. Classically, the surface height is calculated from this signal.
With smartWLI, this correlogram is additionally used to evaluate the quality of the measurement point. FFT-based analysis examines the signal in the frequency domain and detects whether a measurement point contains a reliable interference signal or whether local disturbances, artifacts, or outliers are present.
The decisive advantage: the evaluation is performed point by point. Each measurement point receives information about its reliability. This allows critical areas to be identified without
GPU-Accelerated Quality Evaluation in Real Time
The basis for this extended evaluation is the high computing power of modern NVIDIA graphics cards. FFT-based analysis of each individual correlogram generates enormous amounts of data and is only practical to a limited extent with conventional CPU-based processing — especially when using modern PCIe cameras with high data rates.
NVIDIA GPUs dramatically accelerate this evaluation and make real-time quality assessment possible. Data quality is therefore not assessed only after the measurement, but is available directly during the measurement process.
This offers several advantages:
Large measurement fields can be evaluated faster. Waiting time after data acquisition is reduced. At the same time, a quality layer is generated that can be used directly for AQC, outlier detection, and further evaluation processes.
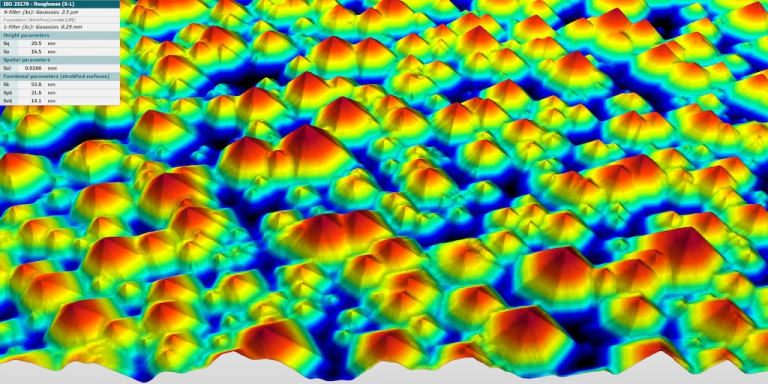
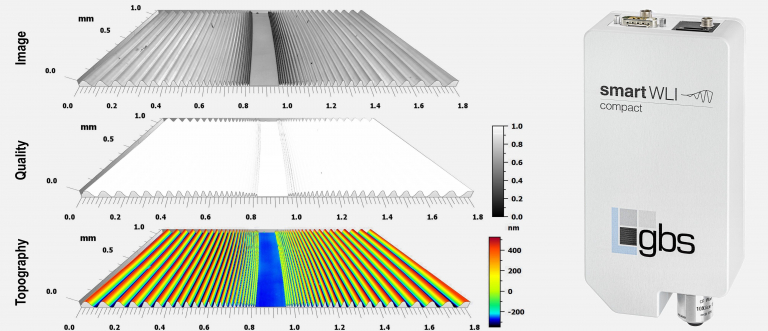
Chirp Standard C5 Example: Where Signal Limits Become Visible
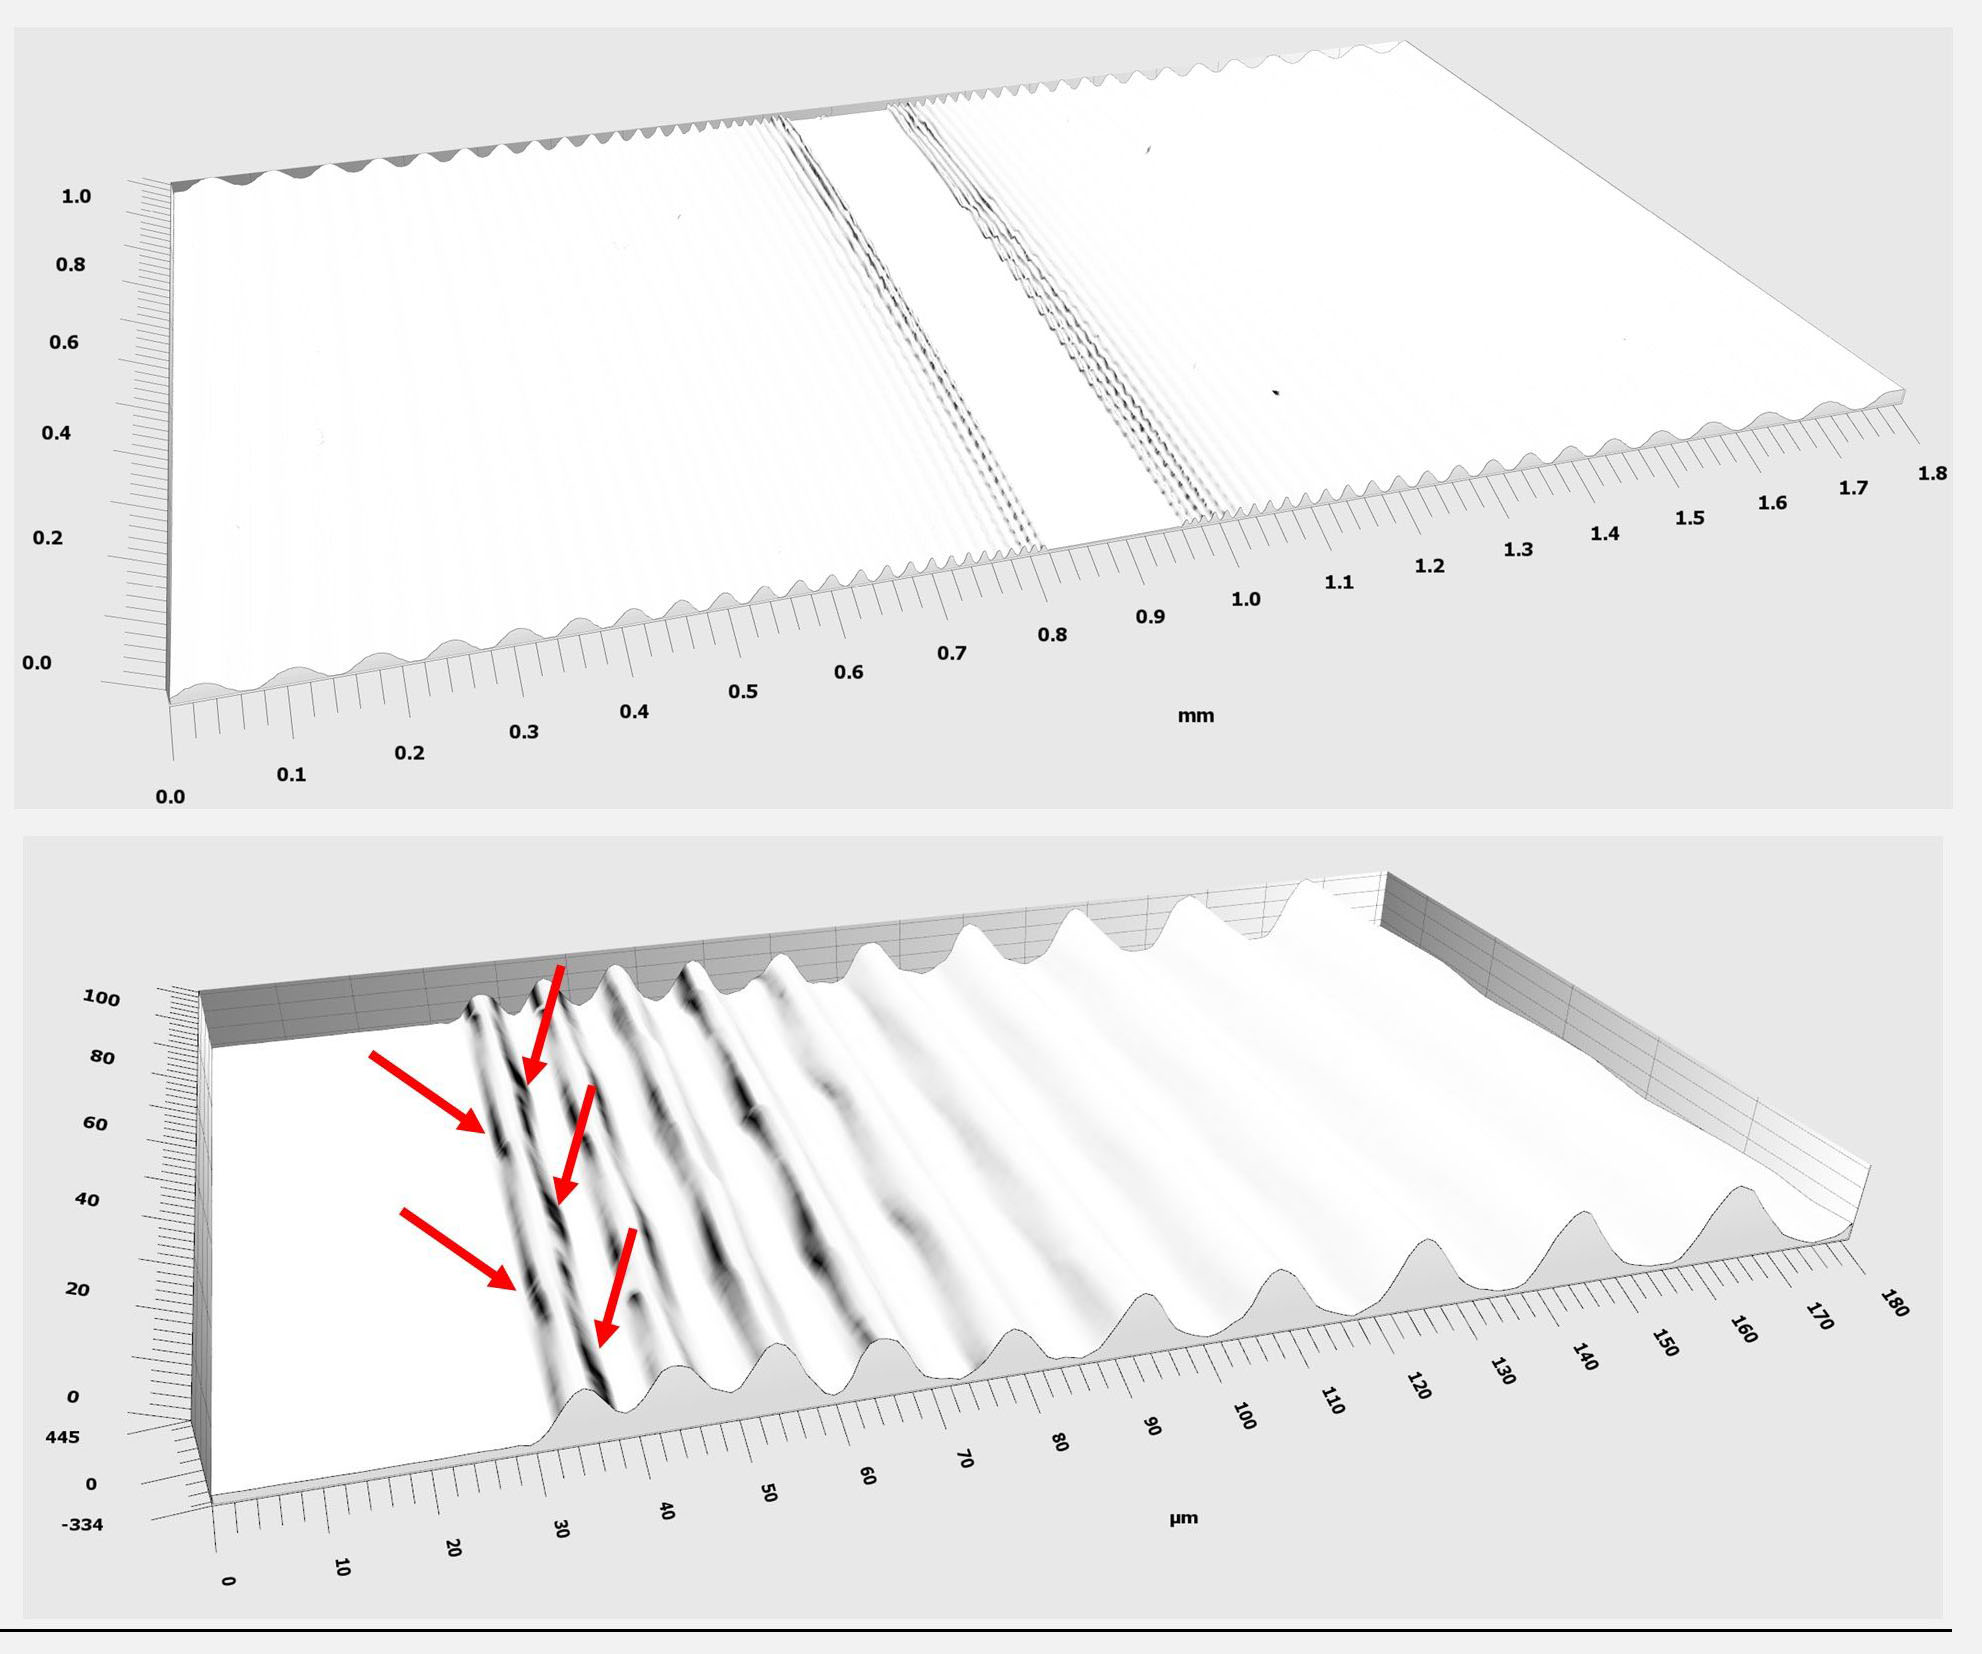
A clear example is the measurement of a Chirp Standard C5. In this standard, the structures become continuously smaller while local slopes increase. Exactly in these areas, the limits of signal evaluation become visible.
The visualization shows a 3D dataset with an overlaid quality map, together with a detailed zoom-in of a critical surface area. Regions with reduced data quality mainly occur at steep flanks, where the local surface slope makes CSI/WLI signal evaluation more challenging.
At the same time, the result shows that well over 99 percent of the measurement points exhibit very high data quality. These points can be used with high confidence for further evaluation. Points with questionable quality, on the other hand, can be removed or specifically passed on to further filtering and evaluation processes that also take local neighboring points into account.
This is metrologically decisive. Individual missing data points often have only a minor influence on the evaluation result. Outliers, however, can significantly distort results. The quality layer helps identify exactly these critical points and enables robust measurement results.
Objective Selection Remains Essential
AQC can evaluate measurement data quality and prevent strongly disturbing outliers. However, it does not replace the correct system configuration. In the Chirp Standard C5, the smallest structures have a wavelength of 9.4 µm. For sinusoidal structures, this corresponds to an autocorrelation length Ral or Sal of approximately 2 µm.
According to the requirement DLIM < Ral, a system configuration should be used whose lateral period limit is smaller than this autocorrelation length. If, for example, a smartWLI compact with a 10x objective and a DLIM of approximately 4 µm is used, the correct structure height cannot be reliably captured. In this case, AQC can primarily prevent strongly disturbing outliers. For precise measurement of the true profile height, an objective with higher lateral resolution should be used.
This consideration is also supported by the Good Practice Guide on the Selection of Instrumentation for Optical Roughness Measurements with CM, CSI and FV, developed within the European TracOptic project by leading metrology institutes and industrial partners, including PTB, INRiM, CEM, DFM, RISE, VTT, and GBS metrology.
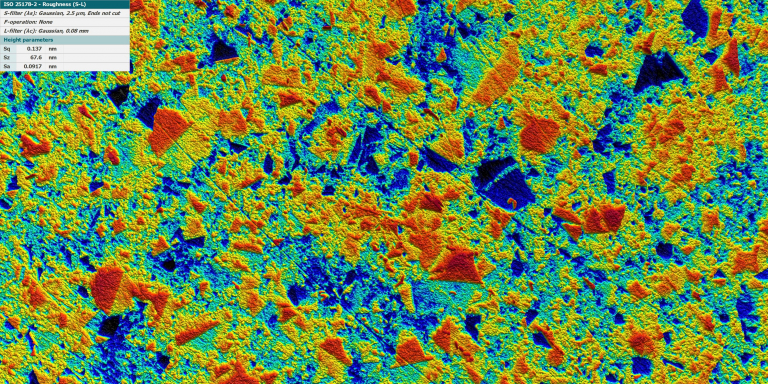
Black Silicon: A Stress Test for Optical 3D Metrology
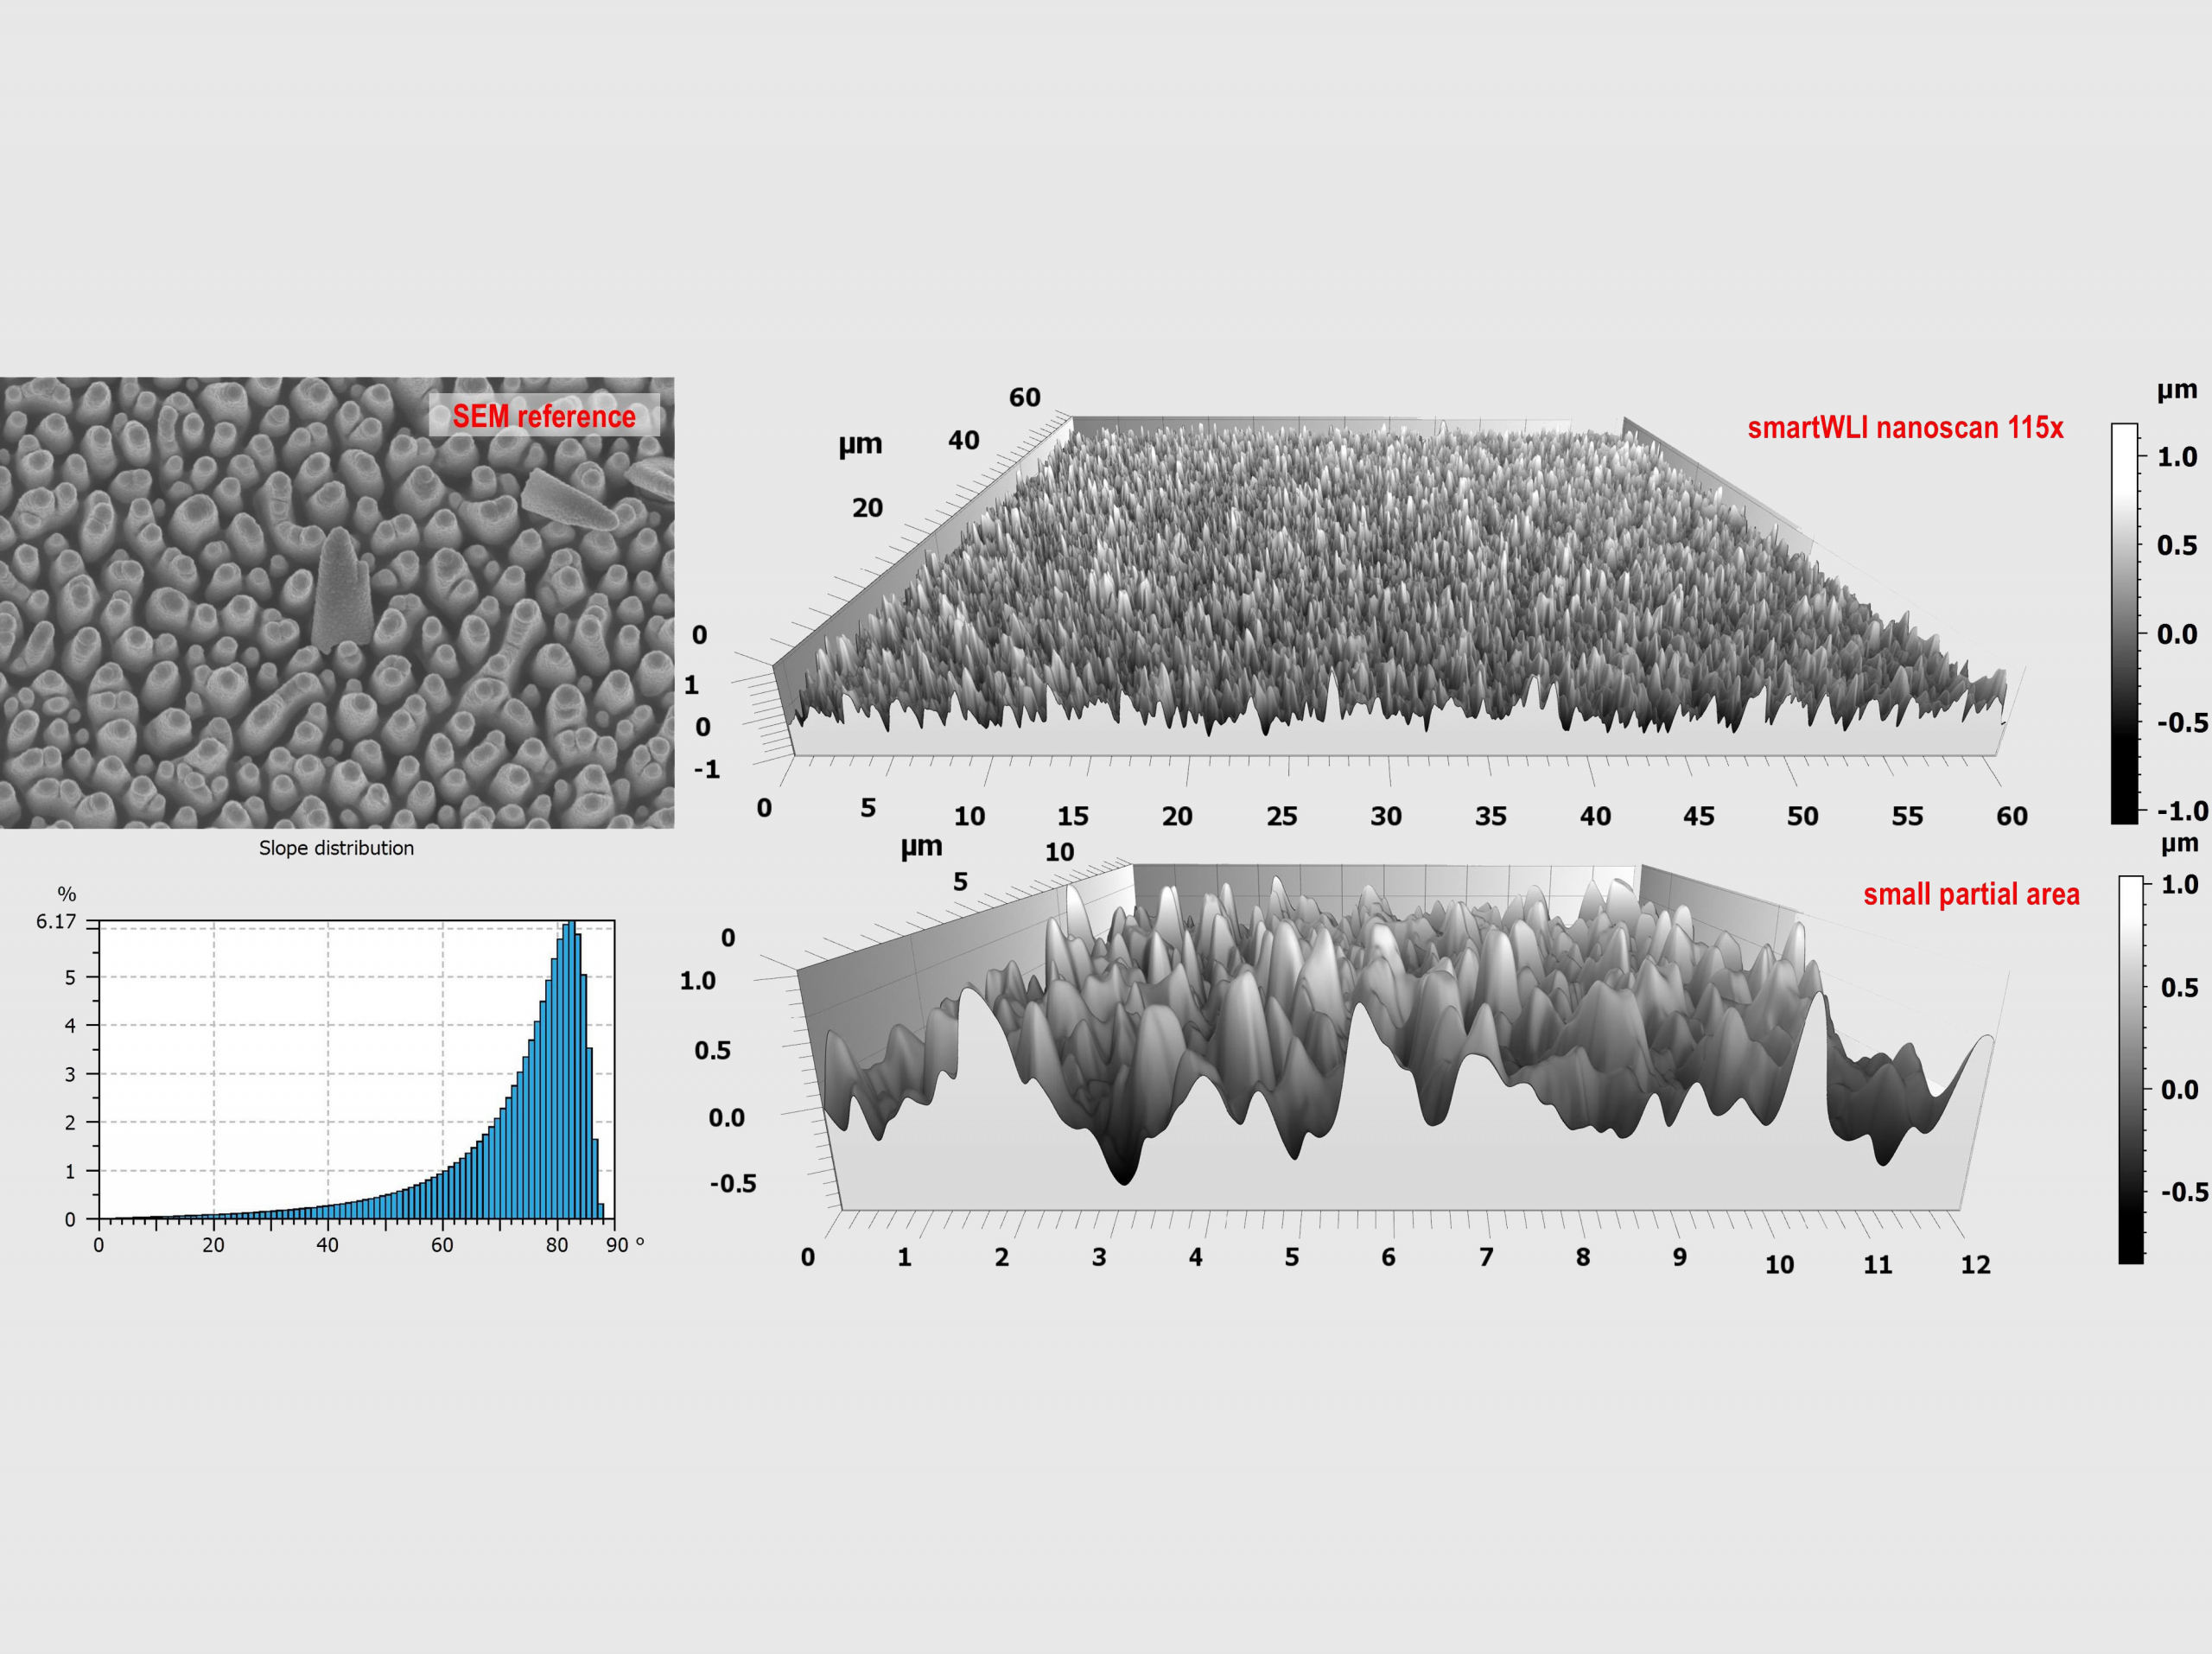
Measurements become even more challenging with Black Silicon. This surface combines very small structures, steep flanks, and complex signal behavior. For many optical 3D measurement systems, this represents an extreme challenge.
Without FFT-based quality analysis, such structures can easily lead to noisy or misleading height data. The reason lies not only in the surface itself, but also in the difficult interpretation of the local interference signal.
The smartWLI nanoscan, equipped with a blue light source and an Olympus interference objective with NA 0.8, is particularly well suited for such fine and steep structures. FFT-based evaluation makes relevant signal components accessible and separates reliable measurement points from artifacts and outliers. AQC uses this quality information so that only trustworthy data contributes to the final measurement result.
This enables robust 3D measurement even on surfaces that are close to the physical limits of optical metrology.
More Than Topography: The Quality Layer as an Additional Information Channel
The quality layer extends CSI/WLI by adding an information level that classical topography data alone cannot provide. In addition to height and image data, a point-wise evaluation of measurement reliability is generated.
This quality data is processed internally within the system and can also be exported by smartWLI users. This allows it to be used for application-specific optimizations — for example, in process control, targeted filtering of critical points, or evaluation of particularly demanding surface areas.
In this way, a pure topography measurement becomes a significantly more comprehensive measurement process: measuring the surface, evaluating signal quality, detecting outliers, and creating the basis for robust decisions.
GPU Power Expands the Application Range of CSI/WLI
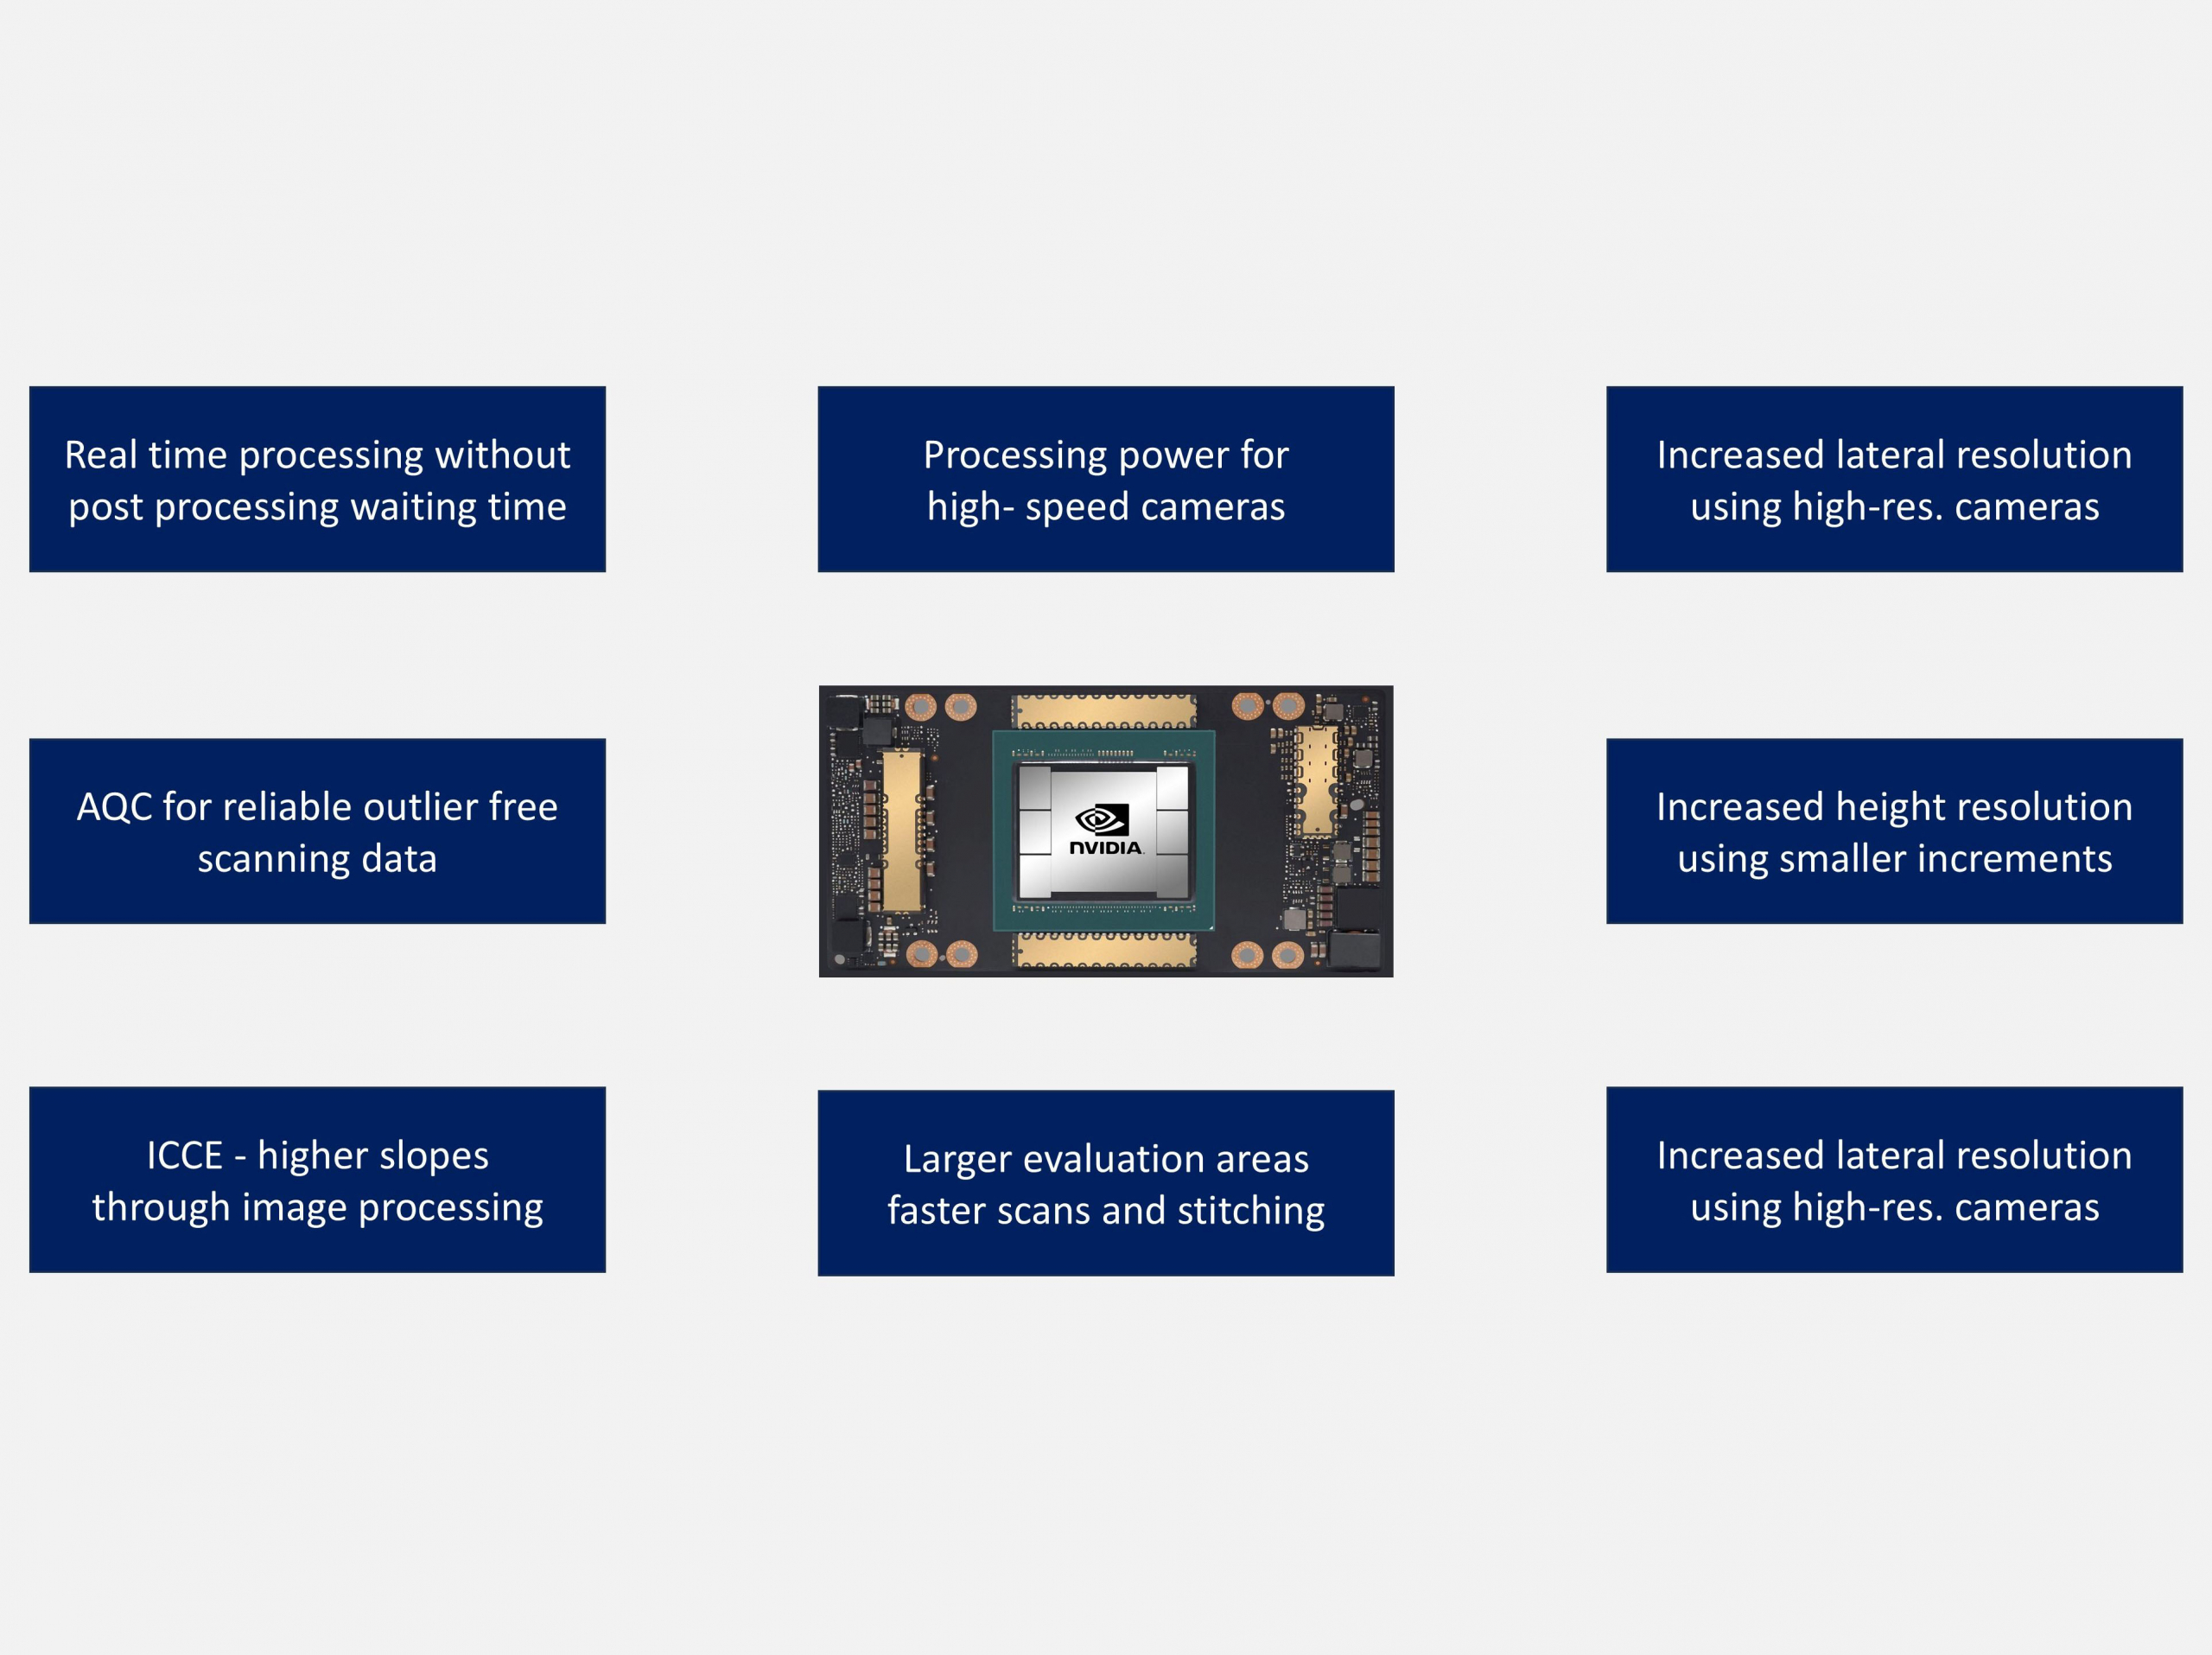
The use of modern NVIDIA GPUs fundamentally changes the practical use of CSI/WLI. Their high level of parallel computing power enables real-time processing of large data volumes, fast FFT-based signal evaluation, and direct quality analysis without long waiting times after acquisition.
As a result, the application range of white light interferometry is significantly expanded. Challenging surfaces, steep flanks, fine microstructures, and complex materials can be evaluated more reliably than with conventional systems without GPU-accelerated quality analysis.
The time when CSI/WLI could be considered purely as height measurement without powerful data processing is coming to an end. Modern optical 3D metrology requires not only high-quality optics and precise mechanics, but also intelligent, fast, and quality-aware signal processing.
Conclusion
The FFT-based quality layer of the smartWLI series makes data quality visible and usable. It detects outliers, evaluates the reliability of individual measurement points, and forms the basis for Advanced Quality Control.
In combination with NVIDIA GPU acceleration, this creates a powerful approach for modern optical 3D metrology: faster measurements, more robust results, and a significantly expanded application range for CSI/WLI — especially on demanding surfaces where classical evaluation methods reach their limits.
Download
Download the full report “Setting New Standards in White Light Interferometry: Making Data Quality Visible” and explore practical examples illustrating these relationships.
Don’t measure just anything. Measure what matters.
Discover more news about GBS
Optical profilometry has advanced rapidly in recent years. While it was once primarily evaluated by how well it…
Read more